Some interesting marketing statistics
Did you know that one of the earliest indications of content marketing dates back to 4200 BC and is a cave painting? Scientists interpreted the depiction as “6 ways a spear can save you from a wild boar”. I wonder how they monitored conversions.
Marketing has been around forever. It’s as simple as getting people to understand that you have something they might need.
A while back, Optimind, a digital marketing agency based in the Philippines, put together an infographic on some pretty interesting marketing statistics that apply globally. They compiled information from sources such as Hubspot, iContact, Unbounce and Moz… among others, it gives a lot of clarity on what we do and its results.
Here is a small selection of some concrete data:
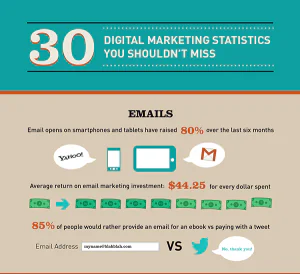
- 85% of people prefer to provide an email for an e-book rather than a tweet.
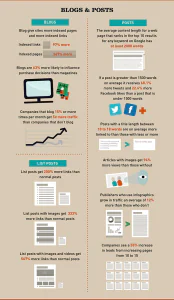
- Blogs are 63% more likely to influence purchasing decisions than magazines.
- Companies that blog more than 5 times a month get 5 times more traffic.
- The average length of content on a page that ranks in the top 10 is 2000 words.
- If a post has more than 1500 words, it receives 68.1% more tweets and 22.6% more likes on facebook.
- Articles with images receive 94% more visits.
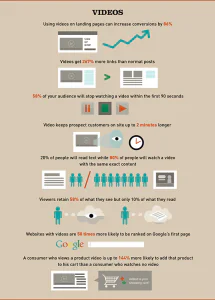
- The use of videos on landing pages can increase conversions by 86%.
- Videos get 267% more links than normal posts.
- 58% of your audience will stop watching the video in the first 90 seconds.
- 20% of people will read text while 80% of people will watch a video with the exact same content.
- Viewers retain 58% of what they see, but only 10% of what they read.
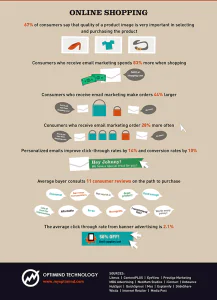
- The average shopper consults 11 consumer reviews on the path to purchase.
Here is the infographic: